Tuesday, November 29, 2016

Position (in) iScore Vector exposes Intron - Protein Relationships?

16,904,172 theoretical k-mers were computed for 12 transcripts of Tp53 downloaded from ensembl. Each transcripts' k-mer set contains 1,408,681 entries computed in the same nucleotide order. k-mers were associated with a signature of the transcript's protein. The protein signatures were computed using the same process.

As previously described a ranking based on recurrence was computed for each k-mer using iScore algorithms. We used a vector which we call PiV to assign each k-mer to a position in the order of the 12 k-mers each for a single transcript. 

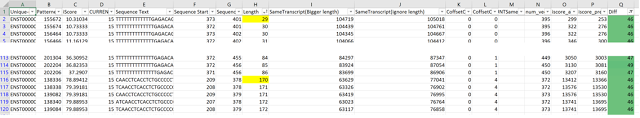
The chart represents, for each transcript the distribution of its k-mers to positions 1-12 based on the iScore and protein signatures. For the 1,408,681 k-mers, at least one position in the vector is dominant in each transcript. 


Sunday, November 27, 2016

k-mers, Vectors, ncDNA (Intron) and Protein Relativity


Following a particular theory of distributed computing, we developed a method using vectors to expose relative differences in the sort order of subsequence's (k-mers) of transcripts of non-coding DNA. Our expectation is that vectors, which have been used successfully to partition data and determine redundancy can also be used to isolate ncDNA k-mers that played a role in the protein the genes coding DNA encoded. 

We first associated each k-mer with the transcript's protein/m-RNA sequence signature. Then, we computed the vector at each [k-mer/protein signature] for all transcripts. We referenced each at the same start or end position in their base sequence. This provided a novel comparison for ranking k-mers of transcripts. 

There are two ways to derive a vector from a k-mer. Transcripts in the image below labeled T1-T4 represent two different ordering methods. The first (left) is a constant because every k-mer of each transcript will have the same protein signature. The second (right) is established using the i-Score of the k-mer. A single application of a max-order rule is applied to re-order transcripts with equal value iScore's provided the re-order equates with a protein signature order.


The image above represents a k-mer of four different transcripts (left) protein signature sort yields k-mer iScore vector (T3,T2,T4,T1) different to protein signature vector (T2,T3,T4,T1). We refer to each transcript k-mers position in this as Protein hash Vector (PhV). On the right the iScore vector (T1, T2, T3, T4) based on k-mer sort, adjusted for max-order to protein signature. We refer to transcript position as Position (in) iScore Vector (PiV). Using these vectors and their differences, we rank k-mer/protein entries for each transcript in the set.

The actual result for the 1000th k-mer of 15 men1 transcripts can be seen here. Each k-mer can be queried independently. 


A new powerful visualization of DNA intertranscript Sequences

Visualizations are very important in interpreting and understand data sets. Often with bioinfomatics it is challenging to visualize certain elements in DNA sequences. Using our methods one can use a powerful technique which can be tuned to ones needs to visualize DNA sequences.

To view and analyze differences in the transcripts of the same gene can be an important tool to compare different DNA sequences. To support this, the advances of image processing and machine learning can further be used to gain insight and find patterns in a large scalable fashion.

To visualize our data all one needs to do is find the center of each sequence to indicate that sequence middle or average position.

For example if one has a sequence which starts at position 310 and ends at 350 then the middle is (310 + 350)/2 = 330. For each transcripts one can plot the Position in iVector value relative to the sequences center value. One can also add another dimension like Diff as well if they like as the colour variable of each point.

The images below show the results for the 6 SET ensemble transcripts and the 15 MEN1 ensemble transcripts. In these images the length maximum was 50.

SET Transcripts


MEN1 Transcripts


In the image above one can see the MEN1 transcripts. Certain groupings were made based on image similarity. Also the numbers indicated transcripts with the same protein amino acid sequences. There are 5 - ones (1) and 3 - twos (2) and 2 - threes (3). Once can see that for sequences that have the same protein sequence there exists a similarity in the images.


Subsequence Recurrence and Inherent Length Bias


As reported, using our sequence amplification tool every possible subsequence of a single strand DNA sequence is represented and independently analyzed. One example for a TP53 intron transcript of 400 nucleotide's (letters) produced +77,000 subsequence's containing a total 10,735,712 letters.  

We queried and counted the recurrence of every subsequence among the letters of every subsequence using bigger length and ignore length parameters. To normalize length bias we introduced iScore, which divided the subsequence recurrence count by the subsequence length according to the following formula;

iScore 
(Subsequencei)=(Offset_Count_Ignore_Length(Subsequencei)- Offset_Count_Bigger_Length(Subsequencei) ) ÷ Length(Subsequencei)

To our surprise when we sorted all subsequence's by iScore, more than 95% maintained their length groupings. Moreover, each susbsequence has a unique recurrence inherent in its letters and relative to the letters of each other subsequence from the sequence.

men1iScore subsequence's
We further confirmed that iScore can accurately identify functional and known RNA sequences in previous research.

For instance using the men1 gene's iScore report for Transcript 313, which as stated has normalized length we identified that at the 10-11 length change junction a group of subsequence's that retained their length group offered up meaningful information.

For men1, two short subsequence's in the junction were functional. When our further analysis revealed both short subsequence's AGCCTTGTGAG and GTGGAATCTT were located in a single longer subsequence we were able to discover the RNA strand compilation in the image on the right.


Inclusive DNA sequences - new metrics with Codondex

Sequence Text Search using Codondex

At Codondex one of our central metrics that we have developed is known as iScore. Please see iScore Documentation to view how we calculate iScore.

Like a kmer, but variable we start from (L)ength 7. Assuming a sequence L=400 we compute 399 398, 397...7 kmers. Then, for every kmer we query the kmer subsequence in all kmers and count recurrence.


The red text in the image above represents the variable length kmer, analyzed per offset/window.

The iScore algorithm will count all of these kmer’s as well as their recurrence in other kmers generated from other parts of the base sequence.

We also use a metric called the theoretical iScore which are the recurrence due to the patterning algorithm. In this post we are not going to go into the mechanics of how this is calculated. We can then subtract the real iScore from this theoretical iScore to find how many recurrences from other parts of the base transcript.
Using this system we can then isolate parts of the sequence with highest recurrence in other parts of the base transcript and select and filter by length of the subsequence (kmer) and start and end positions in the base sequence.

Here a sample table which was developed using these metrics with some filtering.


Saturday, November 26, 2016

Exceptional Symmetry of DNA Sequences


We thought long and hard about signals and interactions between proteins as they move over each nucleotide. We came up with a few different ideas that may be representative of encoding, but limited any novelty to agree with Watson Crick. In the end we settled on a subtle, but alternative way of counting nucleotides for coding protein or other signaling. We tested it, made certain our results were not random and eventually used it to direct our research.

First we iterated the development of a sequence amplification tool to compute and segment every possible subsequence (k-mer/n-gram) of any single strand DNA sequence, so that each subsequence could be represented and independently analyzed. One example for a TP53 intron transcript of 400 nucleotides (letters) produced +77,000 k-mers containing a total 10,735,712 letters.  From this we made a striking observation of sequence symmetry that could not be observed without obtaining these k-mers.

Pattern(Si) = Si-7...Si | Si-8...Si | Si-9...Si | ... | S0S1...Si
For example: G0T1G2G3G4C5C6C7A8G9A10C11
Pattern(G0) = Empty (we start at k-mer 7)
Pattern(C7) = GTGGGCCC
Pattern(A8) = TGGGCCCA | GTGGGCCCA
Pattern(G9) = GGGCCCAG | TGGGCCCAG | GTGGGCCCAG
...
Pattern(C11) = GCCCAGAC | GGCCCAGAC | GGGCCCAGAC | TGGGCCCAGAC | GTGGGCCCAGAC

Most discussion about symmetry relates to the recurrence of letters in different regions of a sequence like inverted repeats. Here we demonstrate an added dimension of symmetry by counting k-mer or subsequence recurrence among letters of all k-mers. Systematically, one can expect that a k-mer, if iterated by one letter will not be significantly different from a previous k-mer and for the most part that is true. However, we found approximately 15-20% of k-mers, in multiple gene transcripts shared a unique recurrence (identical count) with a specific k-mer pair.

To clarify pair; we count recurrence of a k-mer in all bigger length k-mers and we repeat this by ignoring length so that smaller k-mers will also be counted if they recur in the k-mer. With this information, we can deduct bigger length recurrence from ignore length recurrence to count forward, toward 5' or behind, toward the 3' end of the sequence. The k-mer pairs we refer to in this document have a pair of equal recurrences for bigger and for ignore length. This can be see in the TP53 example and other transcripts on our web site.